
Ken Loh
Data Specialist
Skills
Excel | Tableau | SQL | Python | Power BI
Professional Certifications
Official and exam-based

Tableau Desktop Specialist
Issued September 2023

PL-300: Power BI Data Analyst Associate
Issued February 2024
Projects
Tableau | Python
Airbnb Listings
In Toronto
Created a Tableau data visualization with data that I cleaned and prepared using Python.
SQL | Python | Tableau
National Gallery of Art
Data analysis and database creation with SQL, data visualization with Python, and dashboard creation with Tableau.
SQL | Python
S&P 500 Stock Selection
Created an updatable SQLite database for stock data, used SQL queries to create DataFrames, and analyzed data using Python.
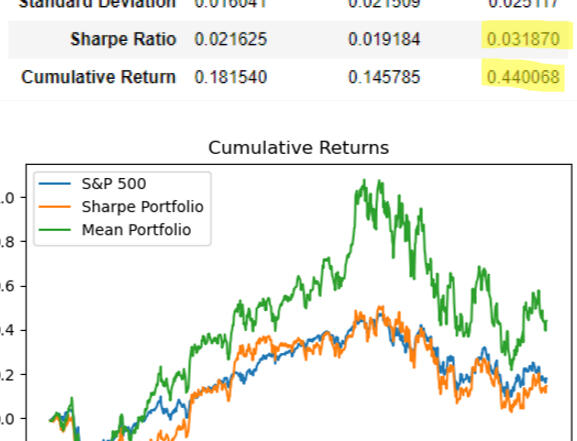
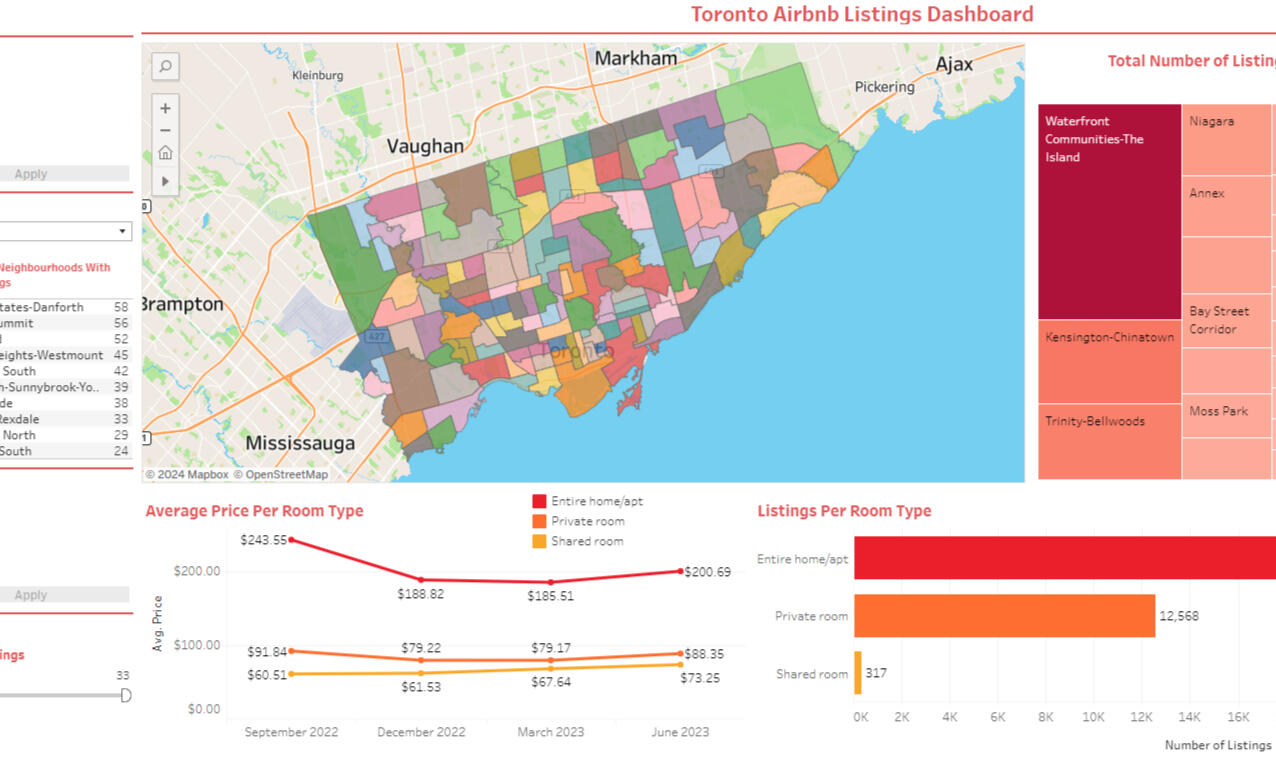
Tableau | Python
Airbnb Market Analysis
and Dashboard
Used Python for data analysis and visualization and Tableau to create an interactive dashboard.
About Me
An experienced financial advisor turned stock trader and entrepreneur, I discovered a passion for data analysis while using it to make data-driven decisions from my own trading data.I also developed a fully automated email subscription service based on my main trend-following trading strategy. Link here.My primary specialties are:
• Excel
• SQL
• Python
• Tableau
• Power BI
• Data Analysis and Visualization
• Simplifying complex ideas for a general audience
• Using data to drive decision-making
• Ability to quickly grasp and apply new tools/technologies
Thanks!
I appreciate your time visiting my portfolio.
Top of page
Tableau | Python
Airbnb Listings In Toronto
Curious about the state of Airbnb listings in Toronto, I put together this project to analyze and visualize details. The data spans from August 2023 to January 2024, sourced from InsideAirbnb. Each month was a separate CSV file, and there was also a GeoJSON file for geographic data.I used Python to:- Clean the data and create a function to clean subsequent CSV files in the same manner.
- Combine all CSV files into one DataFrame, then export it into a CSV to prepare it for Tableau.View Python code on nbviewerI used Tableau to:- Combine GeoJSON table data with CSV table.
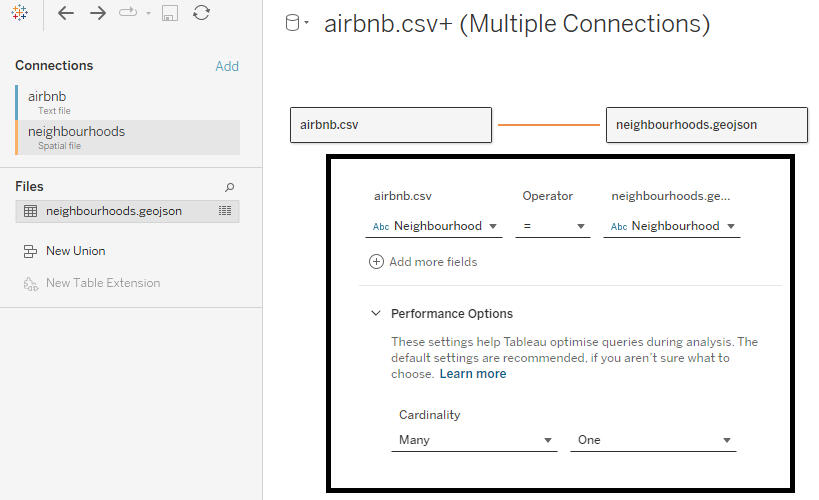
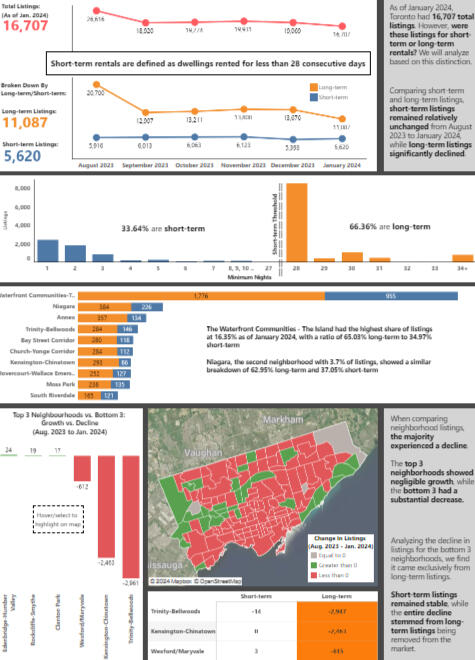
- Create a visualization analyzing the Airbnb listings.Tableau visualization: https://public.tableau.com/app/profile/ken.loh/viz/Airbnbv2_17094345780450/DashboardKey Insights:- As of January 2024, there were a total of 16,707 listings in Toronto.
- Of these listings, 66.36% were for long-term rentals, while only 33.64% were for short-term.
- Waterfront Communities - The Island had the highest number of listings, with 65.03% for long-term and 34.97% for short-term rentals.
- The three neighborhoods experiencing the largest decline in listings from August 2023 to January 2024 were Trinity-Bellwoods, Kensington-Chinatown, and Wexford/Maryvale.
- While there wasn't much change in short-term listings, there was a significant decrease in long-term listings over the same period.
SQL
National Gallery of Art
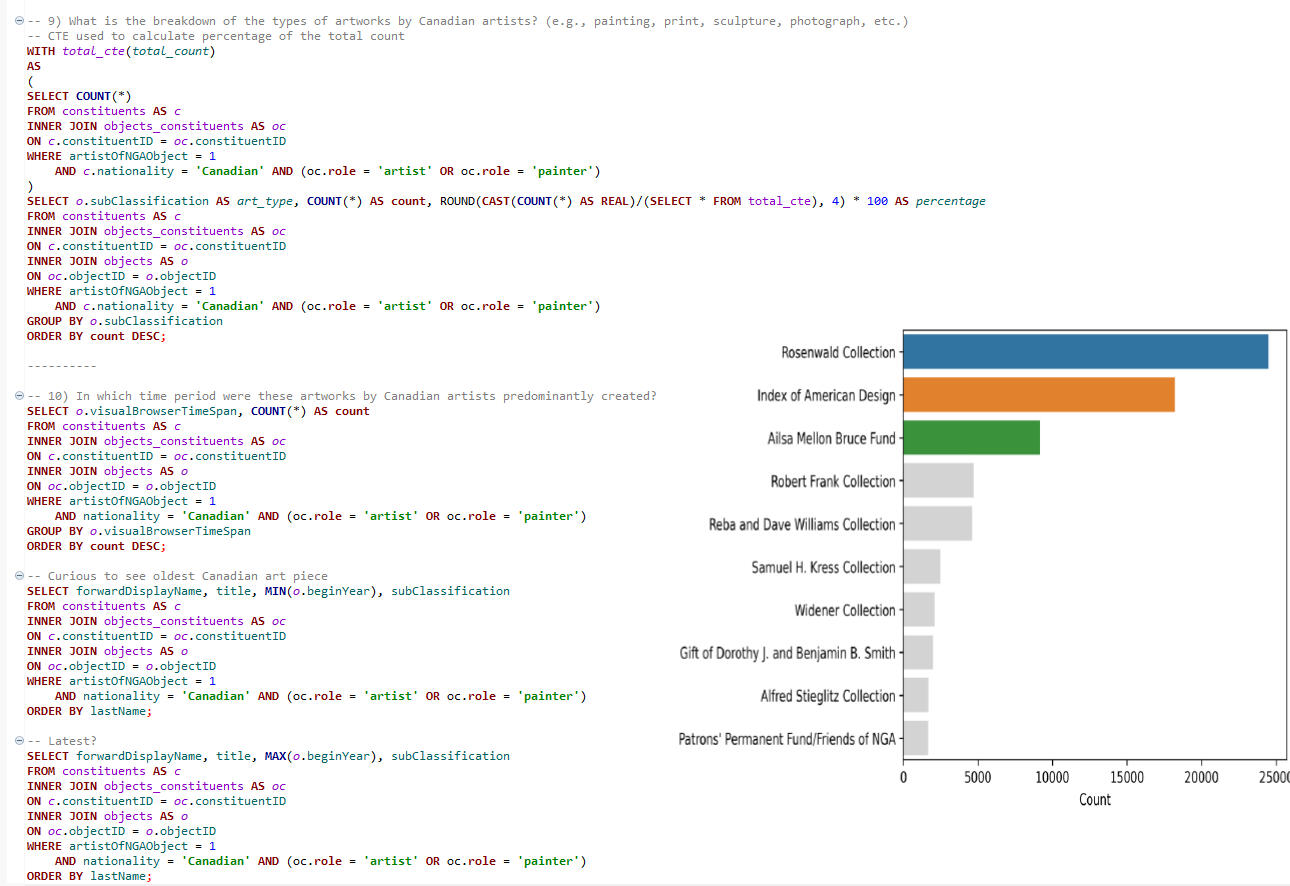
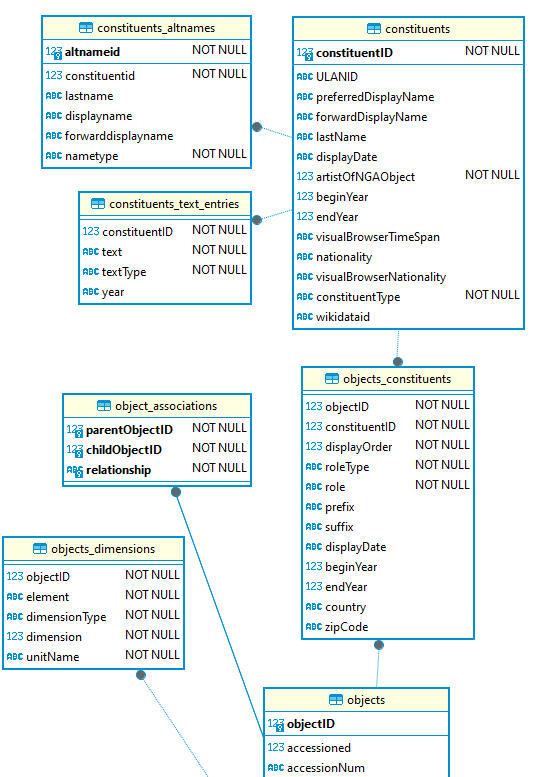
The goal of this project was to use SQL and Python to extract insights from the National Gallery of Art (NGA) dataset provided through their open data program. They offer 17 CSV files along with an Entity Relationship Diagram and a detailed Data Dictionary.The questions I wanted to answer can be found here on the full project GitHub pageI used SQL to:- Create a SQL database based on the NGA's Entity Relationship Diagram and Data Dictionary. For this, I used the database tool DBeaver.View SQL code for the creation of tables on GitHub
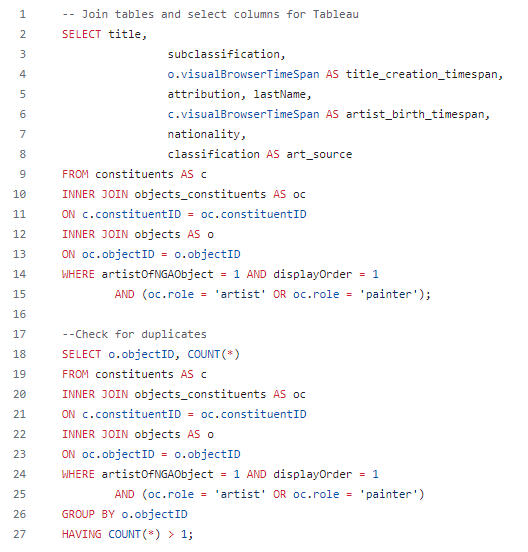
- Write a query to extract the data for Tableau. This involved joining three tables and also included a query to check for duplicates.
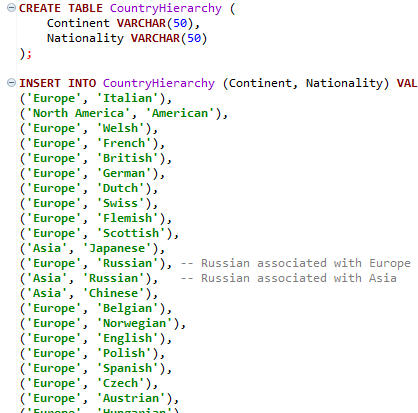
- Create a new table in order to create a hierarchy with continents and nationality, which was not initially provided. This allowed for a drill-down from continent to nationality in Tableau. A list of unique nationalities was extracted first.
- Write SQL queries to answer the project questions.View SQL queries for analysis on GitHubI used Python to:- Connect directly to the SQL database using the Python SQL toolkit SQLAlchemy.
- Create pandas DataFrames from the SQL queries.
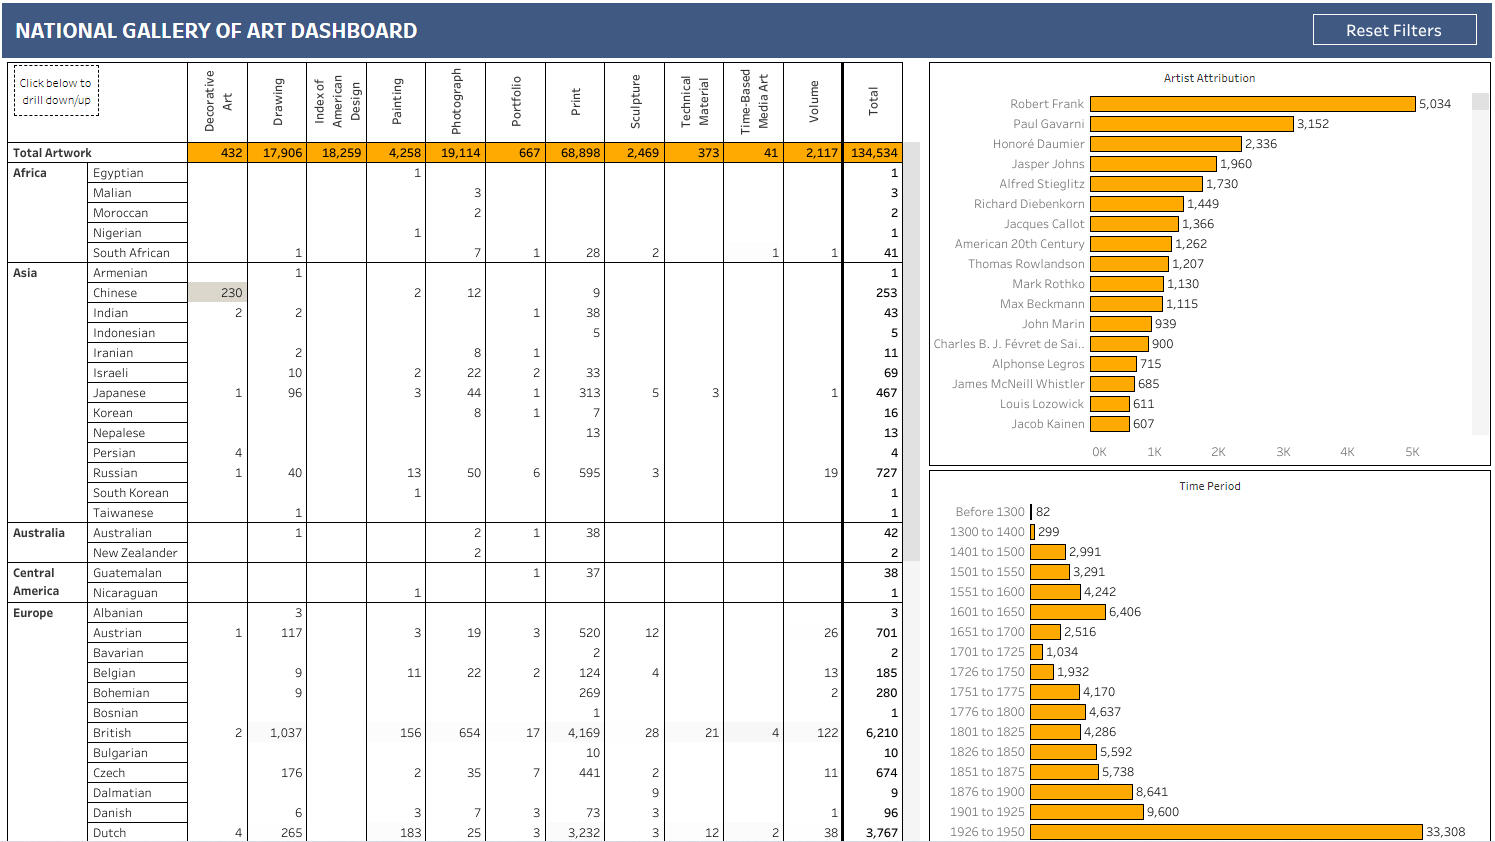
- Generate data visualizations using these queries with Seaborn.View Python code on nbviewerI used Tableau to:- Create an interactive dashboard that allows drill-down functionality from continent to nationality. This was achieved by joining the main table extracted with SQL and the newly created table that matches nationalities with their respective continents.- Enables users to easily answer all the project questions and more.
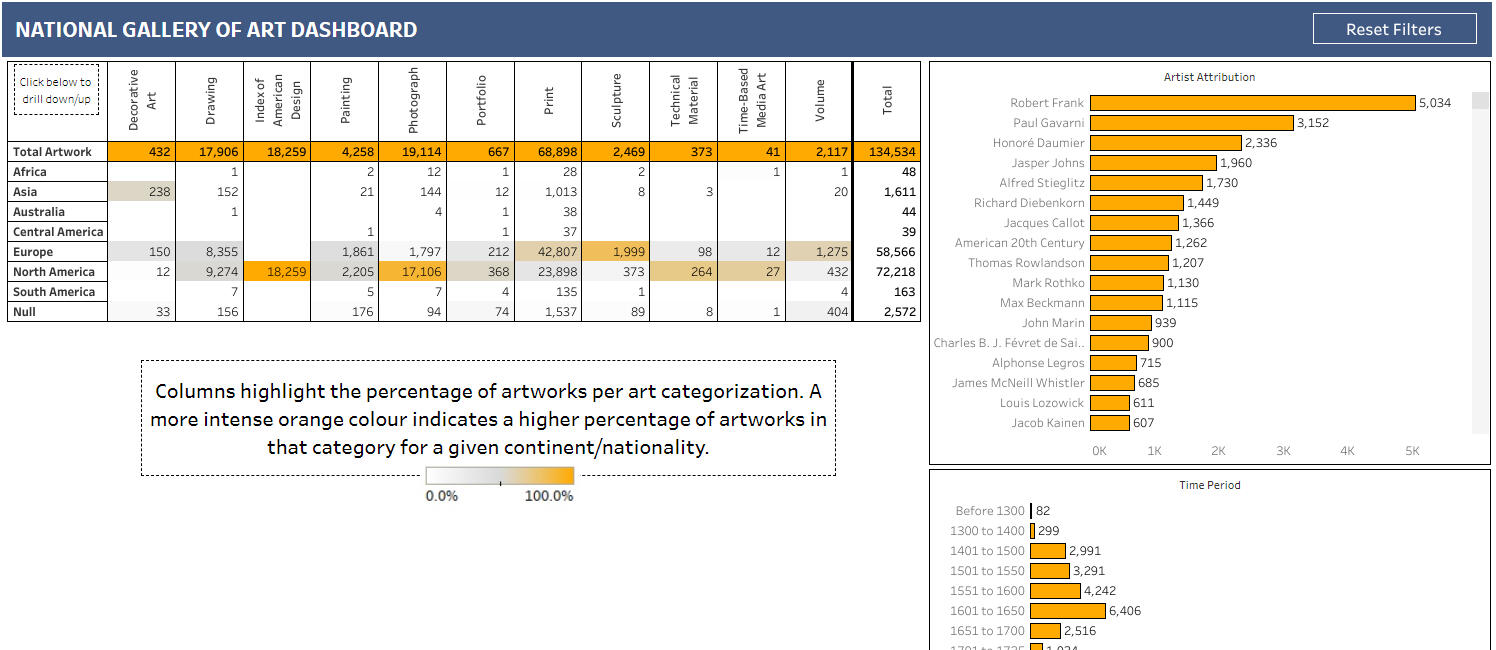
Tableau Dashboard:
https://public.tableau.com/app/profile/ken.loh/viz/NationalGalleryOfArtDashboard/Dashboard
SQL | Python
S&P 500 Stock Selection
The primary goal of this project was to identify five stocks from the S&P 500 index that could be held in an equal-weighted portfolio over a 3-year period, with the potential to outperform the index on both an absolute and risk-adjusted basis.Full project on GitHubI used Python to:- Create an updatable SQLite database using the Python SQL toolkit SQLAlchemy.
- Import stock data from Yahoo Finance.
- Clean and prepare the data using a combination of SQL queries and Python code to pull from the database.
- Perform analysis on stock data and visualize it.View Python code on nbviewerFinal Results:The five stocks chosen when this project was run on August 10, 2023 were:
1) ON - ON Semiconductor Corporation
2) FICO - Fair Isaac Corporation
3) CEG - Constellation Energy Corporation
4) NVDA - NVIDIA Corporation
5) AMD - Advanced Micro Devices, Inc.Currently, their returns as of March 7, 2024 are:
1) ON: -15.11%
2) FICO: +55.40%
3) CEG: +69.86%
4) NVDA: + 118.62%
5) AMD: +91.76%S&P 500 index (SPY) returned +15.28% in that same time period.Full project on GitHub
Tableau | Python
Airbnb Market Analysis
and Dashboard
The primary goal of this project was to gain an overview of the Airbnb market in Toronto, Ontario.View full project on GitHubI used Python to:- Clean and prepare the data.
- Combine multiple CSV files into one.
- Perform data analysis.
- Visualize data using Seaborn.View Python code on nbviewerI used Tableau to:- Create an interactive Tableau dashboardTableau Dashboard:
https://public.tableau.com/app/profile/ken.loh/viz/TorontoAirbnbListings_16899525753990/Dashboard1View full project on GitHub